6. Light Detection and Ranging (LiDAR)
What is LiDAR?
LiDAR (Light Detection and Ranging) is a remote sensing technology that uses laser light to measure distances and create precise, three-dimensional maps of surfaces and objects. It works by emitting laser pulses towards a target and measuring the time it takes for the pulses to return after reflecting off the target. LiDAR is widely used in various fields, including topographic mapping, forestry, urban planning, and autonomous vehicles, due to its ability to capture detailed and accurate spatial information.
Remote sensing* is the process of acquiring information about objects or areas from a distance using aircraft, satellites, or drones. It detects and measures radiation reflected or emitted from the Earth's surface, enabling analysis of phenomena such as vegetation health, land use changes, and weather patterns without direct contact.In this assignment we used ArcGIS to create a 3D map of a region in Utrecht – doing so with open source data from GeoTiles.
RAW DATA
Before converting to LAS, the XY coordinates are set to “RD New,” and the current Z coordinates are set to “None.”
(This coordinate system is used to calibrate the region of the Netherlands.) After converting to LAS, the coordinate system was still "RD New" and there were 62401380 LAS points. LAS is a file format for storing LiDAR data, capturing 3D point cloud information such as spatial coordinates (X, Y, Z), intensity, and classification. It ensures compatibility and standardization for LiDAR data exchange and is used in applications like topographic mapping and 3D modeling.*CLASSIFICATION codes: Unassigned, ground, building, water, reserved. Could add: roads, trees, lampposts…
Looking at Symbology Choices
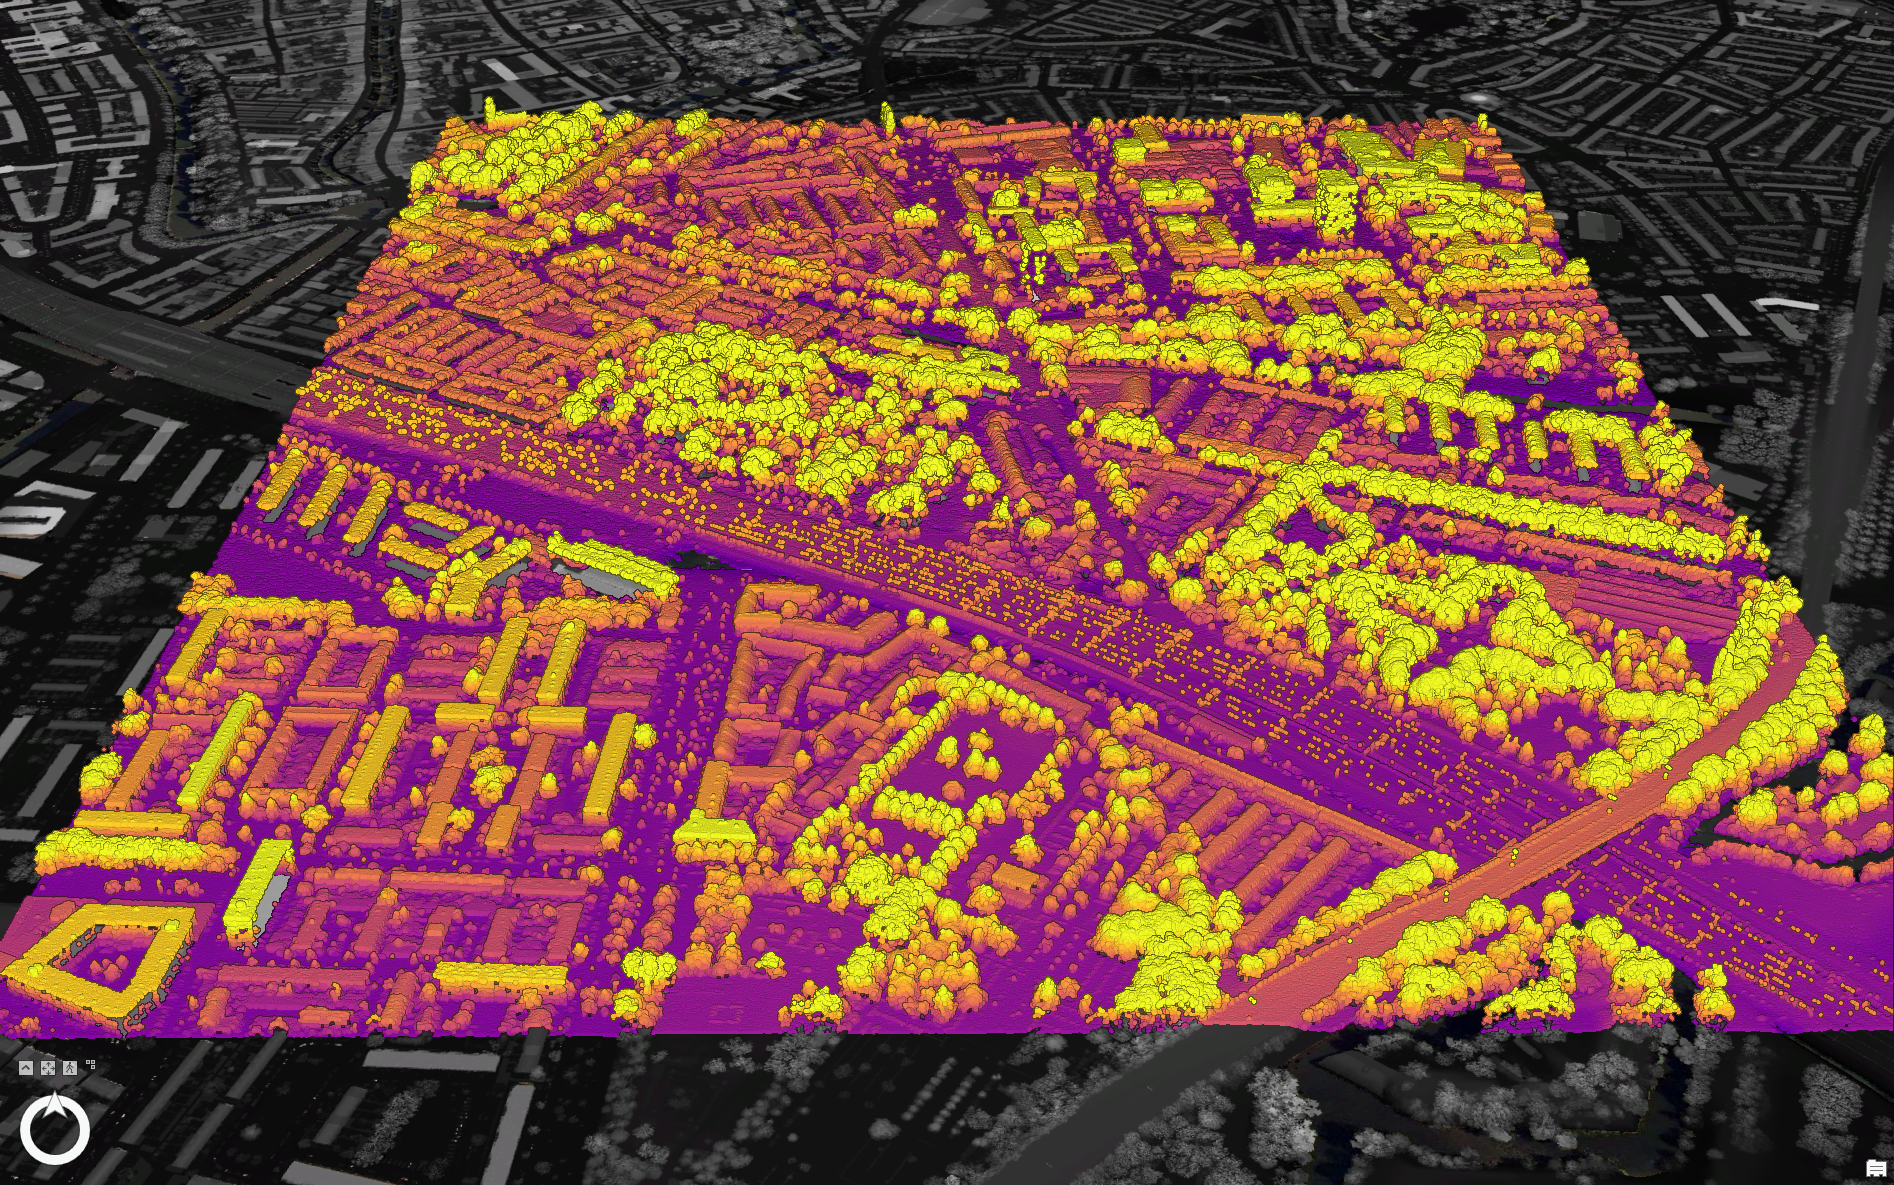
Part of this assignment was to learn how to interpret and change LiDAR symbology to obtain different information. As such, I chose to look at the elevation in the center of Utrecht, and changed the color scheme that ranges from purple to yellow as elevation increases. For me this was the most interesting to look at out of all the symbolization types and it had a more dynamic map with range of color (this was not the case for the other symbolization types) readily offering more information.
Measuring with LiDAR
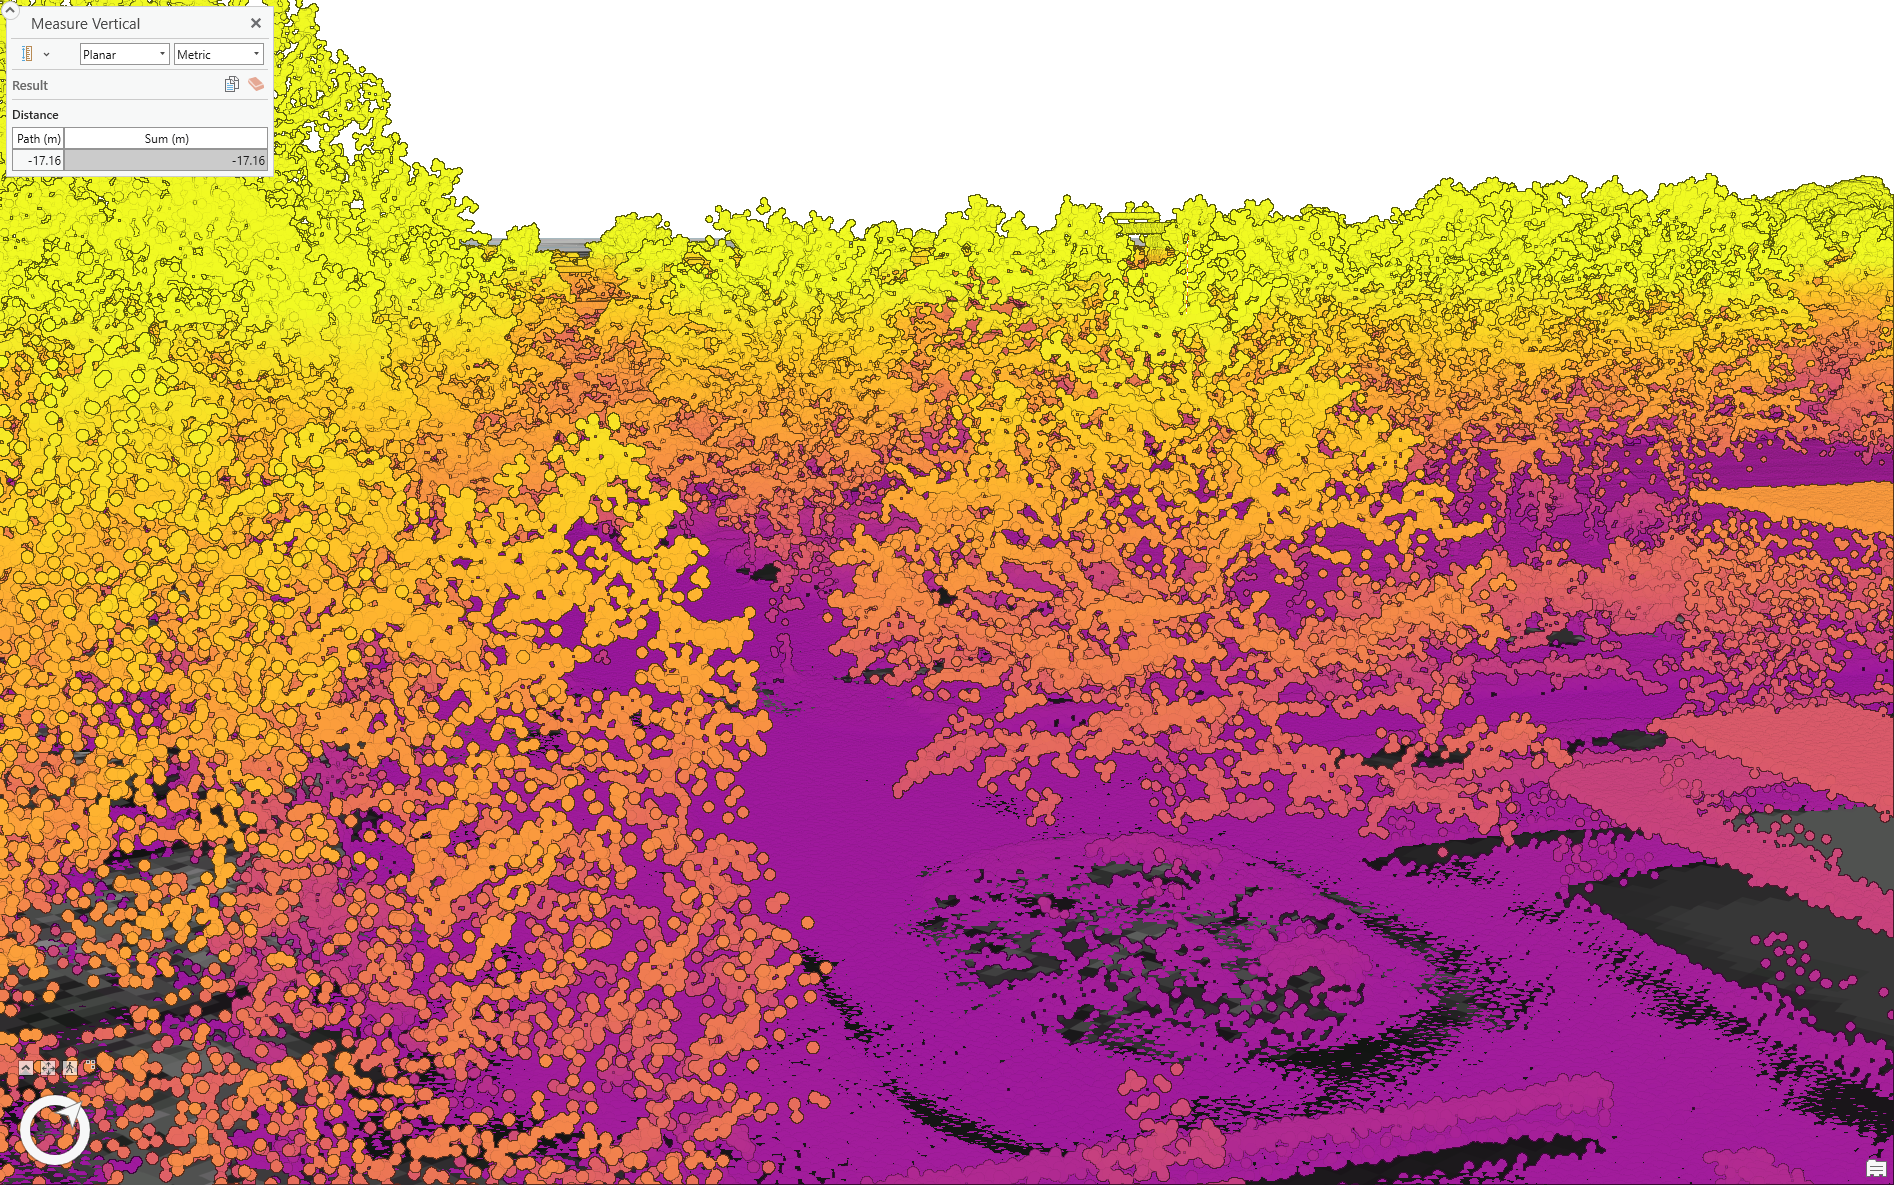
Using measuring tools, I also measured the height of a random object – a tree - in my LiDAR map. My tree is around 17m tall.
Isolating LiDAR Classifications
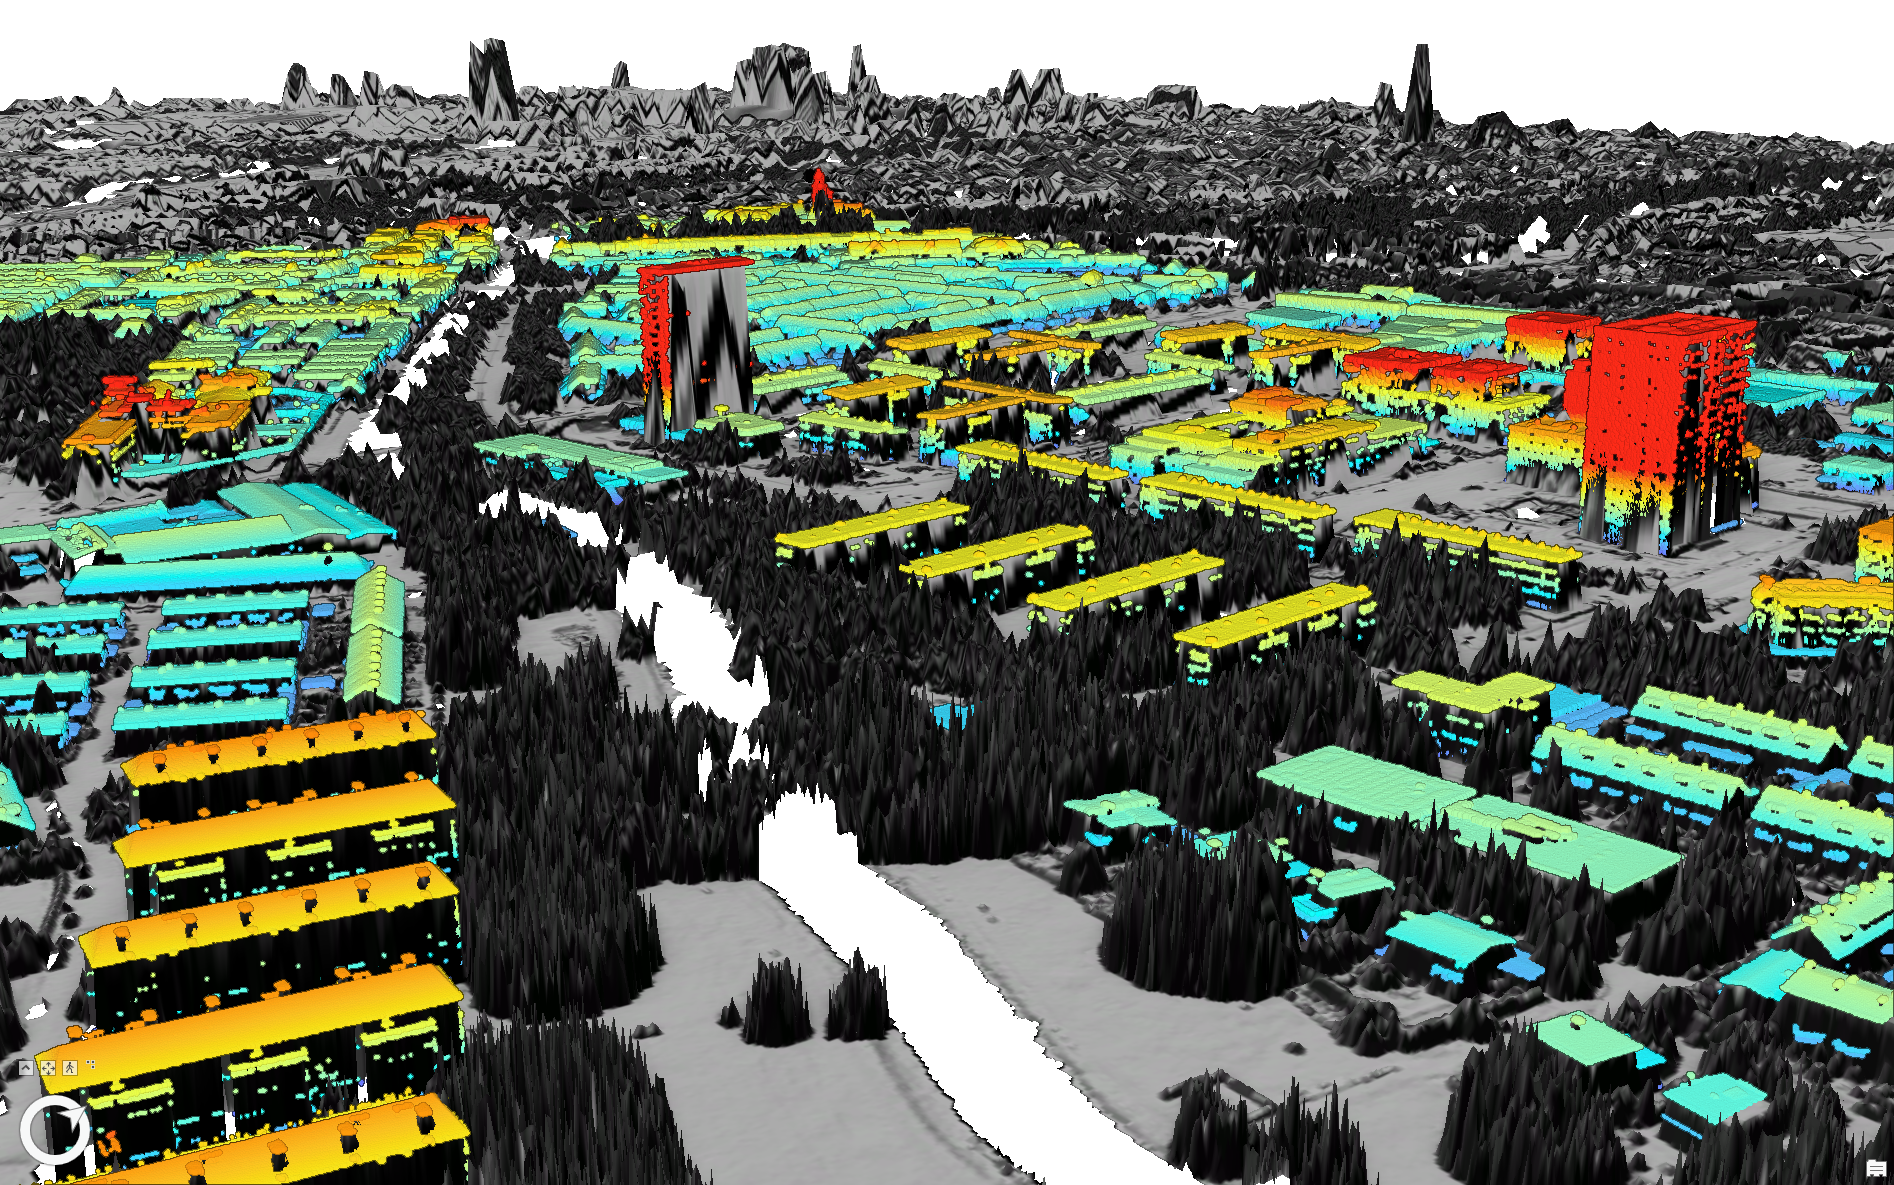
Using analysis tools, I also learned to isolate one of the classified codes from the rest of the recorded LiDAR data. Displaying only LiDAR points corresponding to the buildings in Utrecht.
Skills Aquired: From making this map I further familiarized myself with ArcGIS – I learned how to use LiDAR and interpret LiDAR data through using ArcGIS tools. More specifically, I learned to effectively use symbology to present the information that is relevant to me, as well as how to use measuring tools and how to use analysis to sort between data of different classification codes. Moreover, I also gained a better understanding of the role of coordinates when it comes to data and mapping.