4. Relative Elevation Model (REM)
What is REM?
A Relative Elevation Model (REM) is a topographical representation that shows the elevation of terrain relative to a specific reference point within a localized area, rather than absolute elevations relative to sea level. This model highlights relative height differences, providing detailed insights into features like hills, valleys, and depressions. REMs are created using methods like LiDAR, photogrammetry, and satellite imagery, and are particularly useful in applications such as flood risk management, urban planning, environmental monitoring, and agriculture. By focusing on local elevation changes, REMs enable enhanced visualization and detailed analysis for various practical uses.
Chosen region of interest (ROI): Region of river Maas near Roermond, southern Netherlands
For this assignment we had to chose a region of interest and analyse the relative elevation of the river bank. The reason I chose the river Maas is that it was located in a region that nobody else (in my lab) was analysing and also because it is part of the 'Grote rivieren' (Great rivers) of the Netherlands.
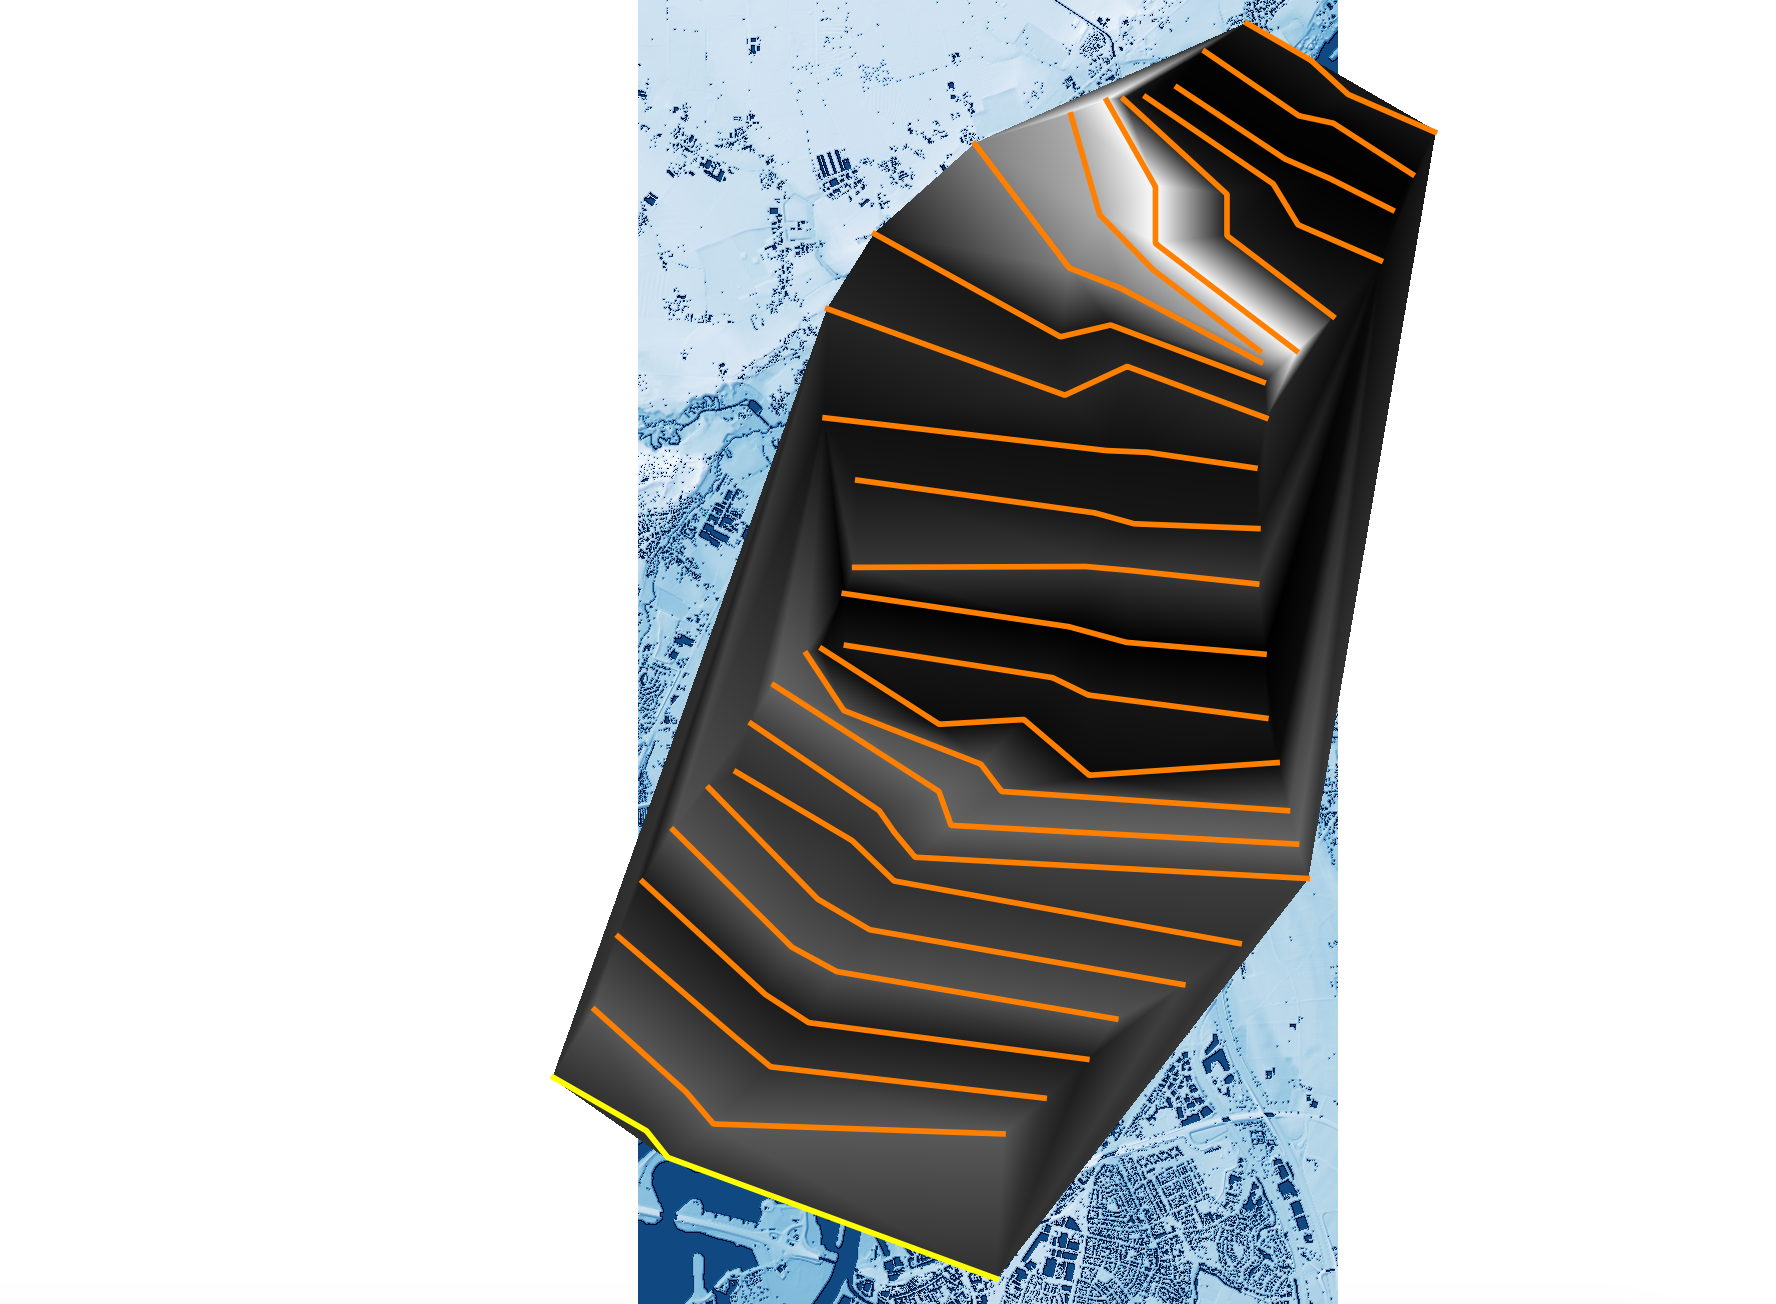
Once the ROI was chosen, we gathered DTM (Digital Terrain Model) open source data from GeoTiles and transferred it to QGIS. The data was then subject to multiple tools and calculations to transform it into the final map. Some of the most crucial steps in this conversion include a creating a cross-section layer, where elevation points along the river bank where manually labeled; and a TIN interpolation step, which crops-off the area of interest (in this case the river region). An illustration of these two steps can be seen in the image below, where the orange lines represent the crossections and the silvery shape represents the TIN layer.
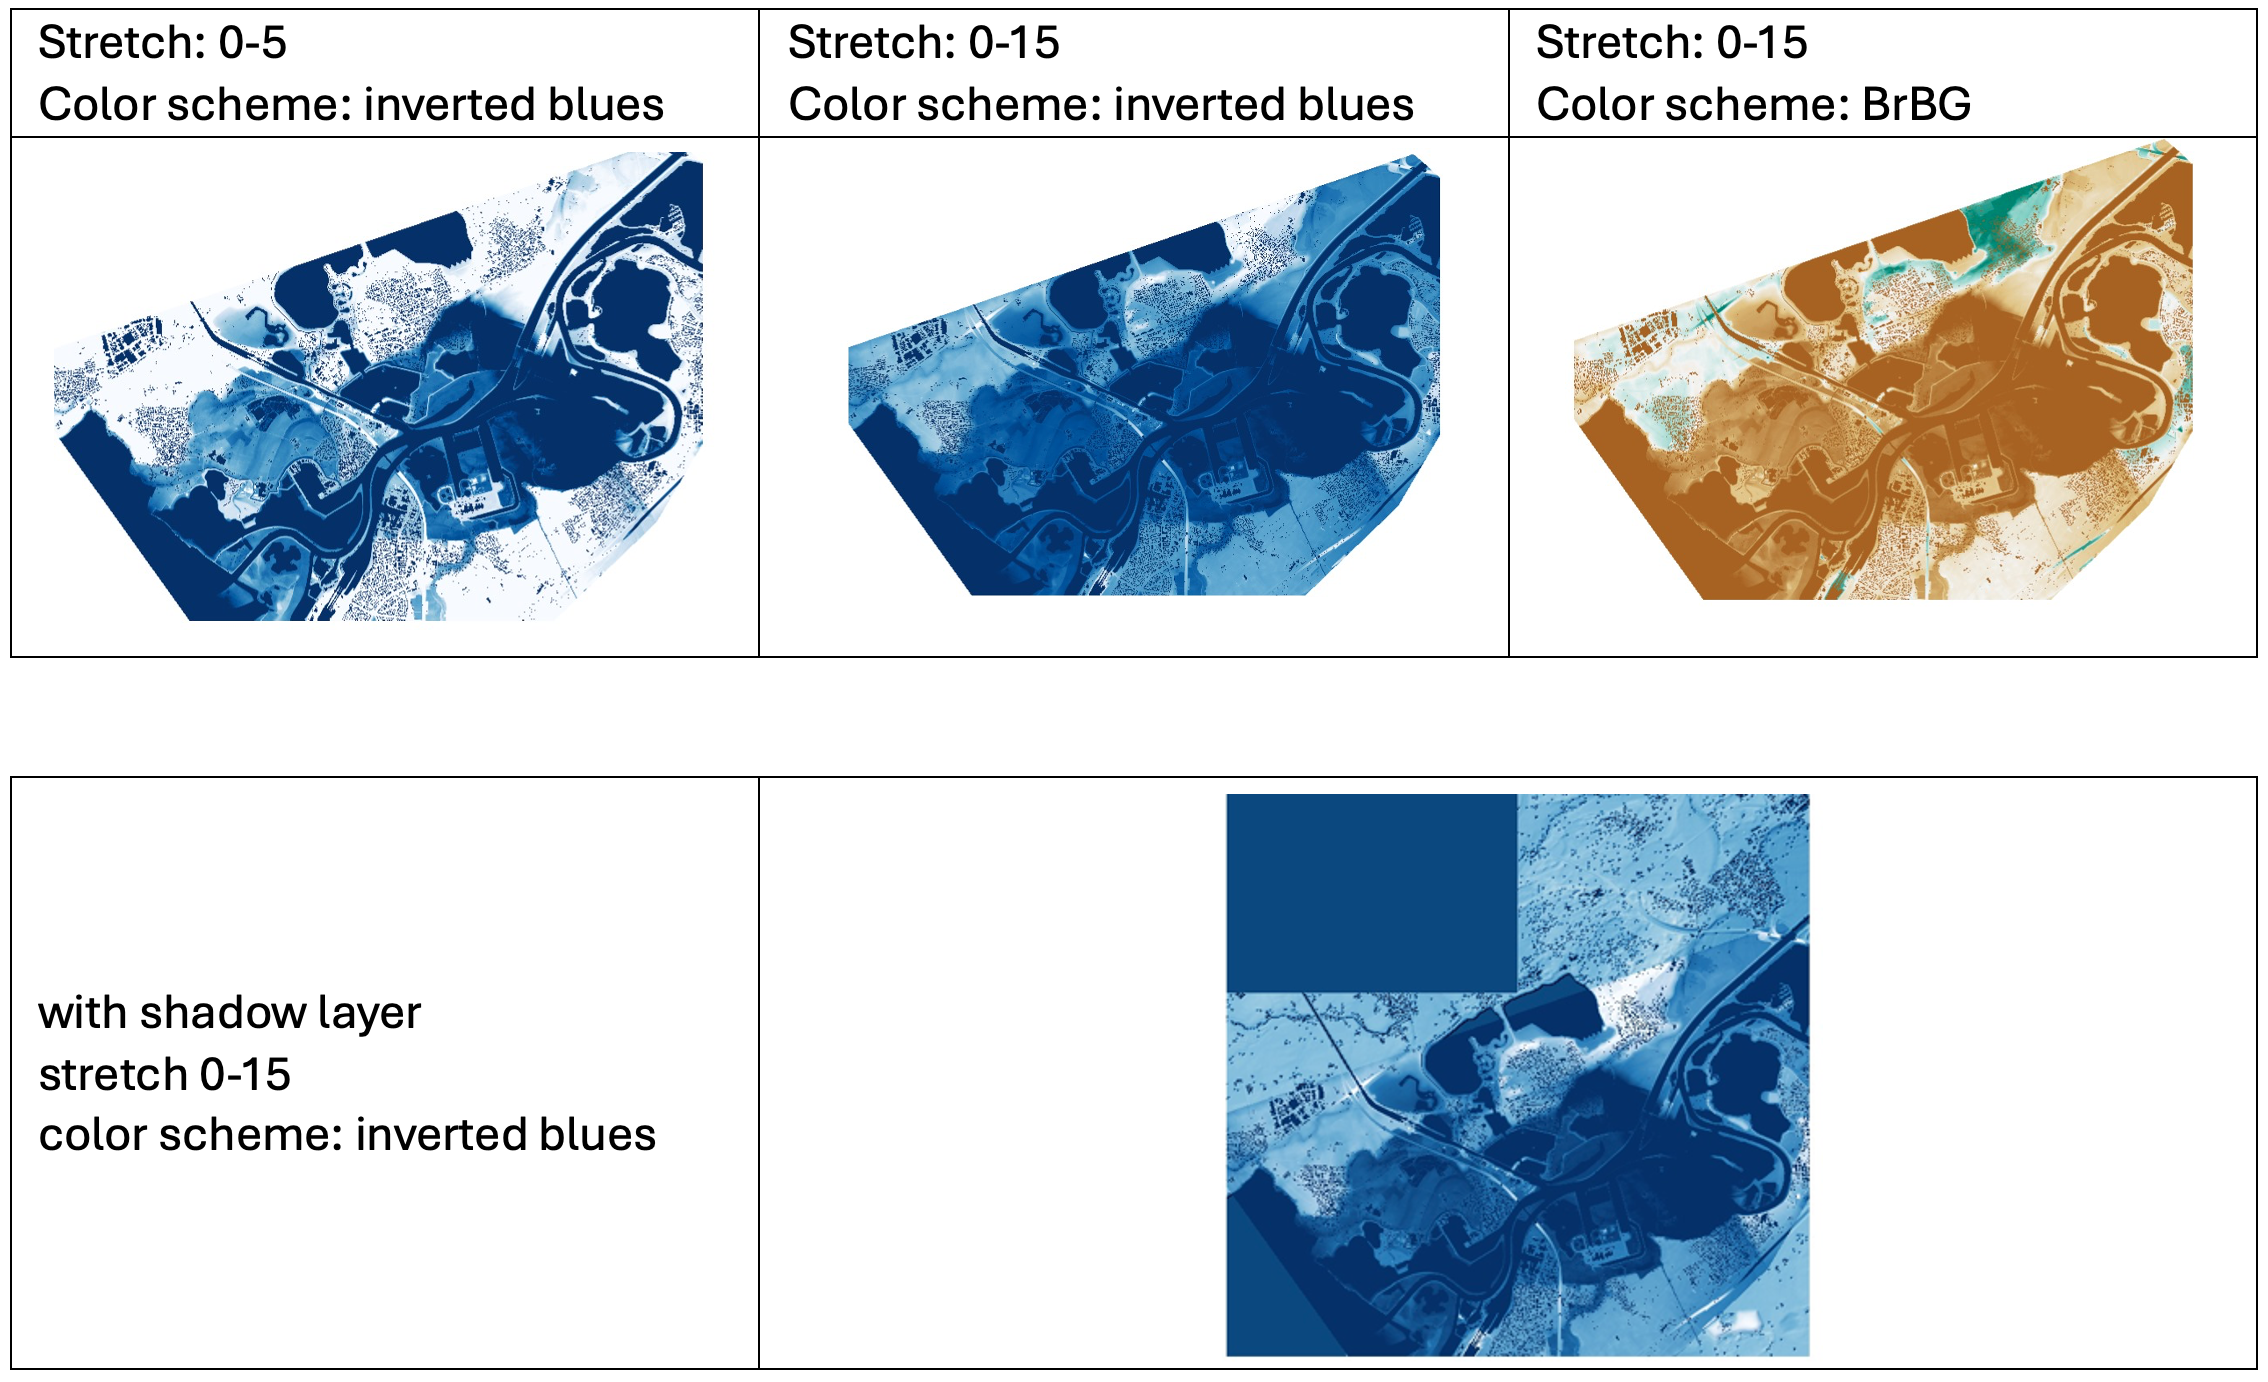
Before making the final map, I played around with some of the symbology settings such as the stretch and the color scheme to find out which symbology was favourable in presenting my data. The main findings where:
- A larger range (stretch) allows for a more accurate description of differences in elevation and makes it easier to distinguish nuances in the map.
- A color scheme that goes from light to dark (or vice versa) is nice for representing elevation as a gradient and makes it easier to interpret the data. The chosen inverted-blue color scheme does well in representing the area as the dark blue region clearly marks the 0km elevation reference point on this map (i.e. the river) and lightens as elevation increases. Moreover, is also appropriate for the land use mapped (blue = water) but also, a monochromatic color scheme is much more convenient for representing a gradual index as is elevation.
Skills Aquired: Through this assignment I became even more comfortable using QGIS. I also learned a lot about the importance of scale and color scheme when it comes to portraying data. Moreover, I learned new cartographic features (some of which are present in the final map below!) and new analysis tools that can help in focusing in on a chosen region.
Final REM map
As for the final map, the results can be seen below – including scale bar, title, legend, and north arrow.
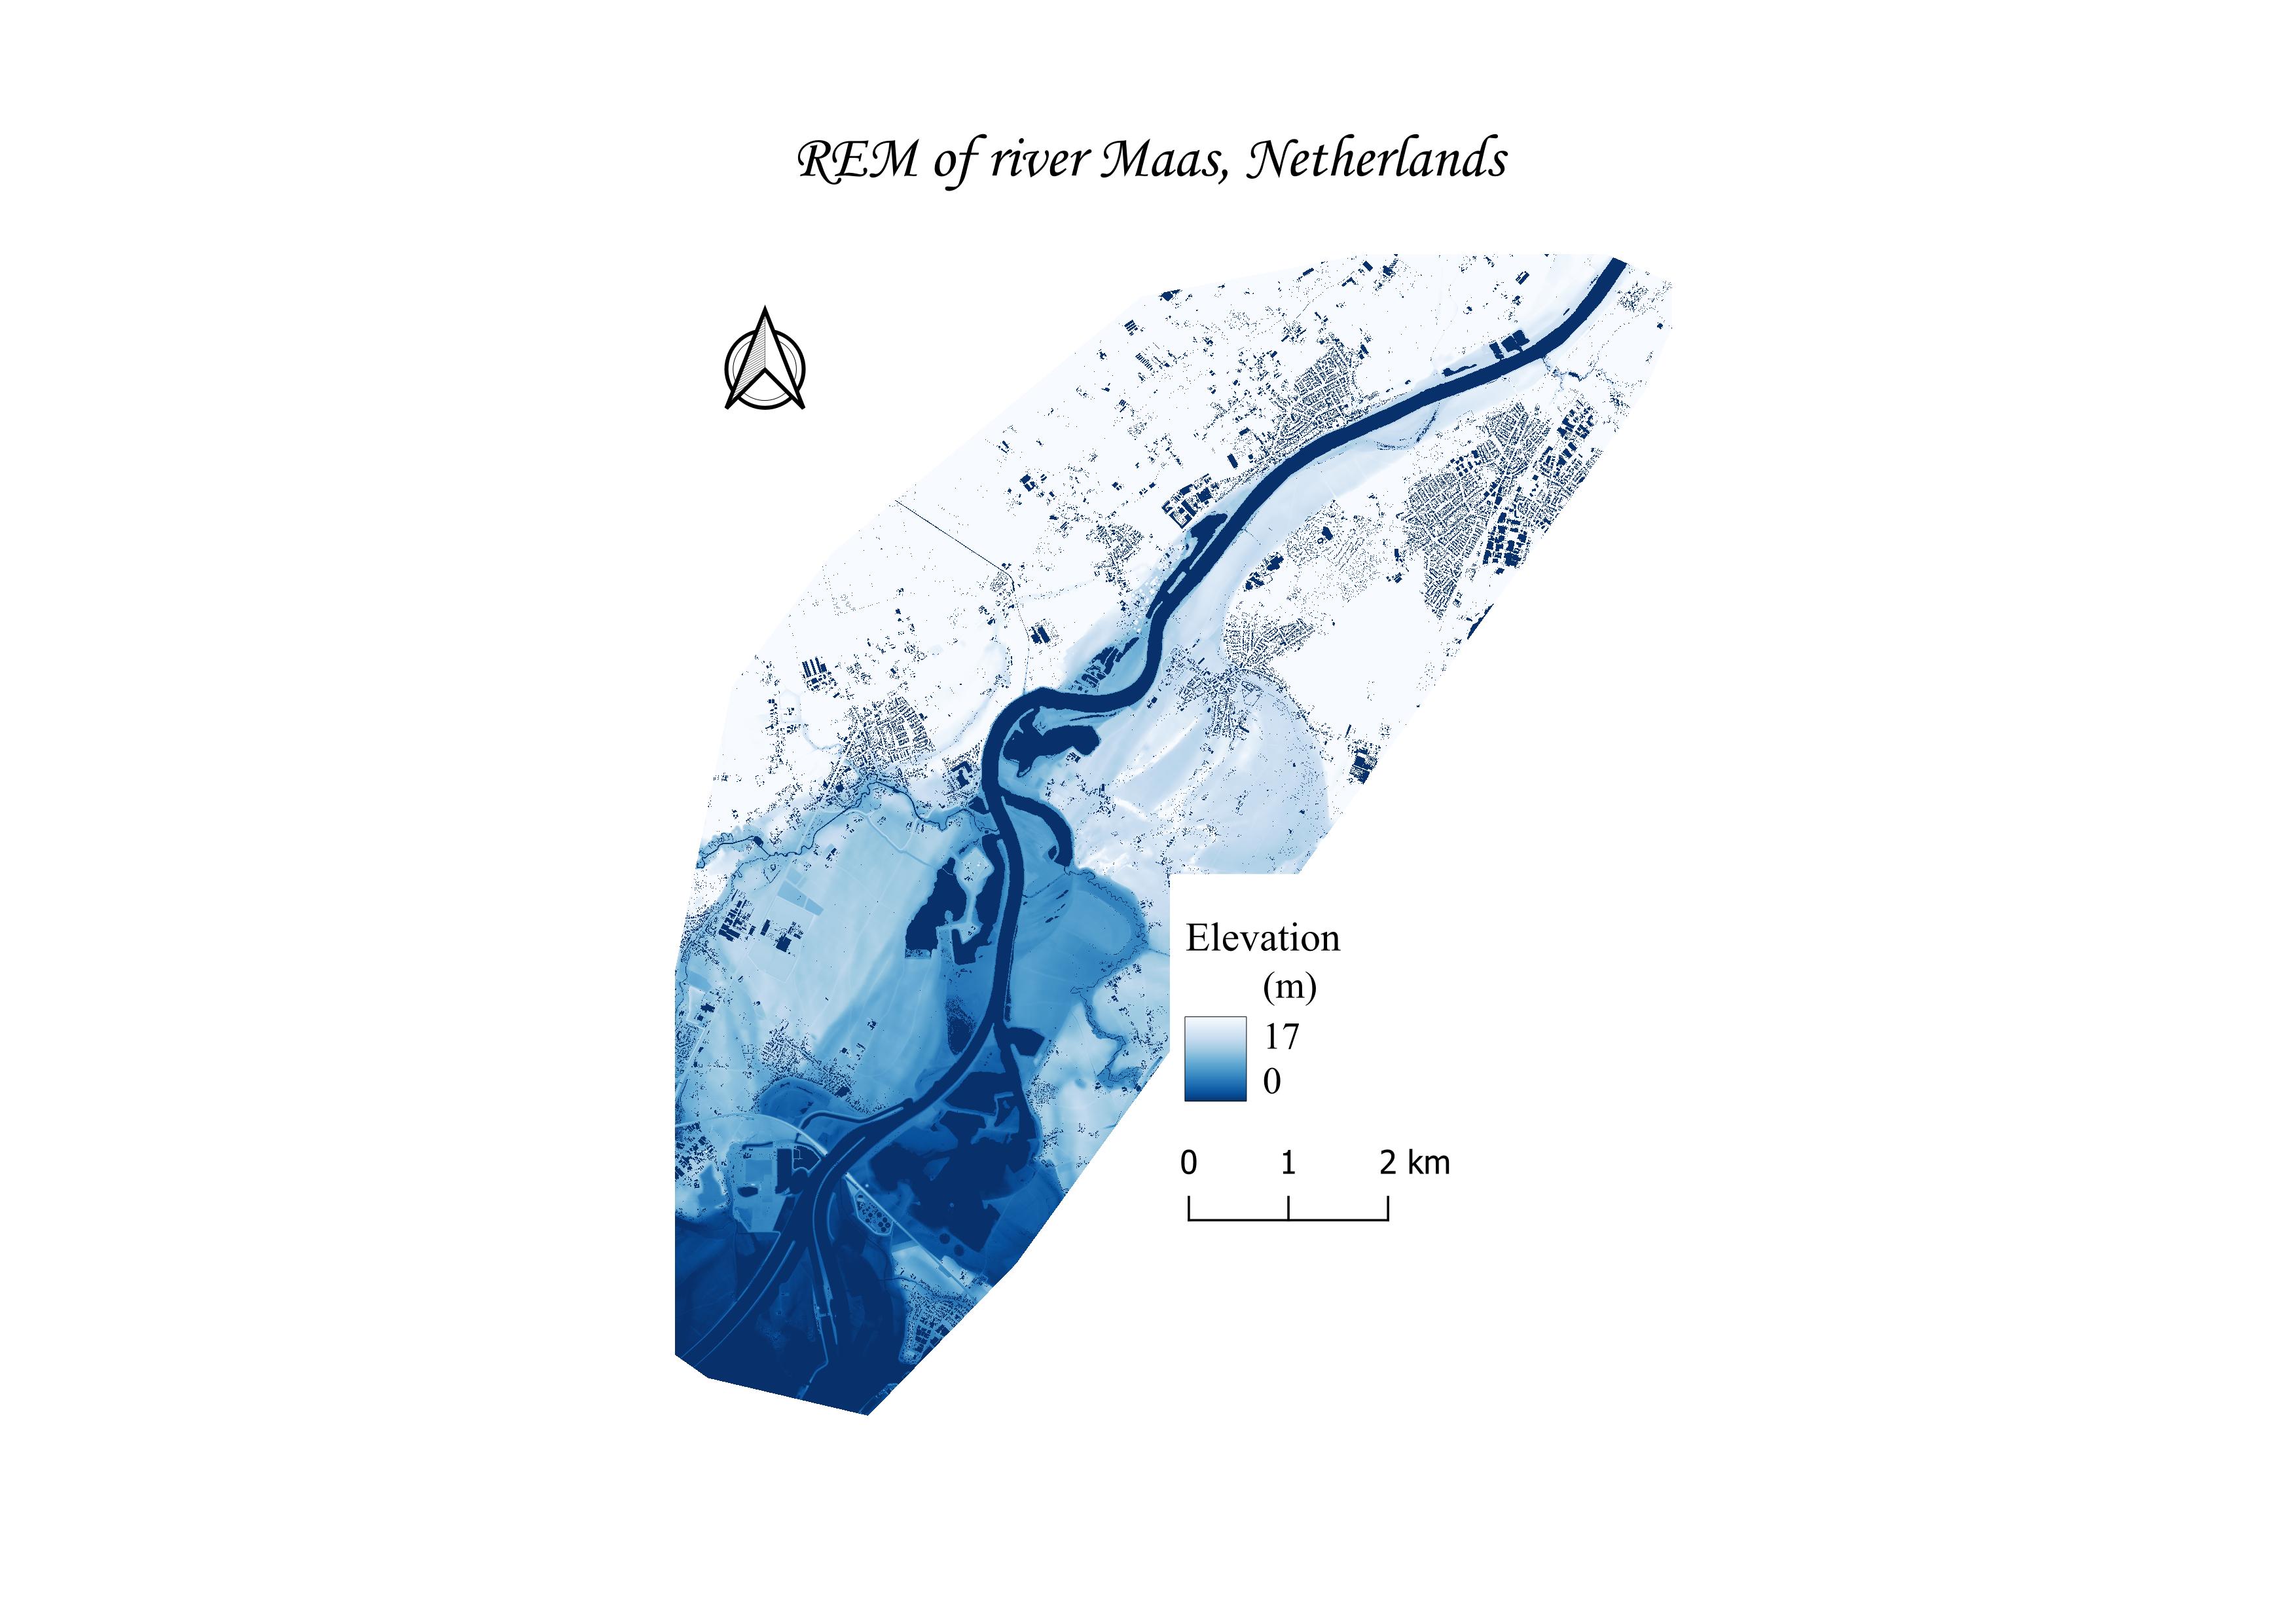
Do you think there was a lot of flooding in this area?
From the data I can see that the elevation is quite consistent around 14 throughout the entirety of my riverbank region. Since this is quite low and flat I would guess that this area is susceptible to flooding.