3. Landcover Classification
True vs False Color Composite
True color and false color composites are techniques used in remote sensing to visualize and analyze images from satellites or other sensors. A true color composite uses the red, green, and blue (RGB) channels to create an image that closely resembles what the human eye would see, making it ideal for general visual interpretation and public distribution. In contrast, a false color composite assigns visible colors to non-visible wavelengths, such as near-infrared, to highlight specific features like vegetation health, water bodies, and geological formations. True color composites offer a natural appearance, while false color composites, though requiring specialized understanding, can reveal details not visible in true color images, aiding in environmental monitoring, agricultural assessments, and urban planning.
GROUNDWORK
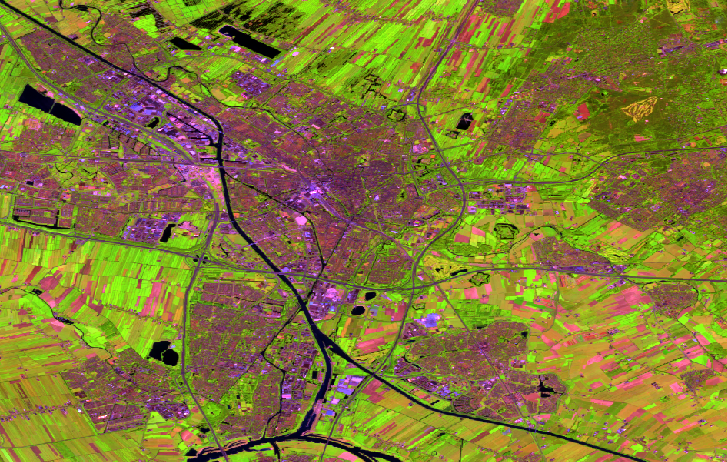
In preparation for this assignment (see below) we played around with "color composites" and how to use them to our advantage to best show landcover. As such, I created a false color composite of Utrecht highlighting agricultural landuse.
(False) color composite used:
Red Band 11
Green Band 8
Blue Band 2
"True color composite":
Red Band 4
Green Band 3
Blue Band 2
In this map, agriculture should be prominent because it uses short wave Infrared–1 (B11), near-infrared (B8), and blue (B2). The first two bands are useful in monitoring crop health as they are good at highlighting dense vegetation (shown as dark green). In reference to the image above, I see that in Utrecht there is not much green – which makes sense given that it is a city and there are no crops. Additionally, around Utrecht there is some green present – which is fitting of the crop and forest areas that surround it.
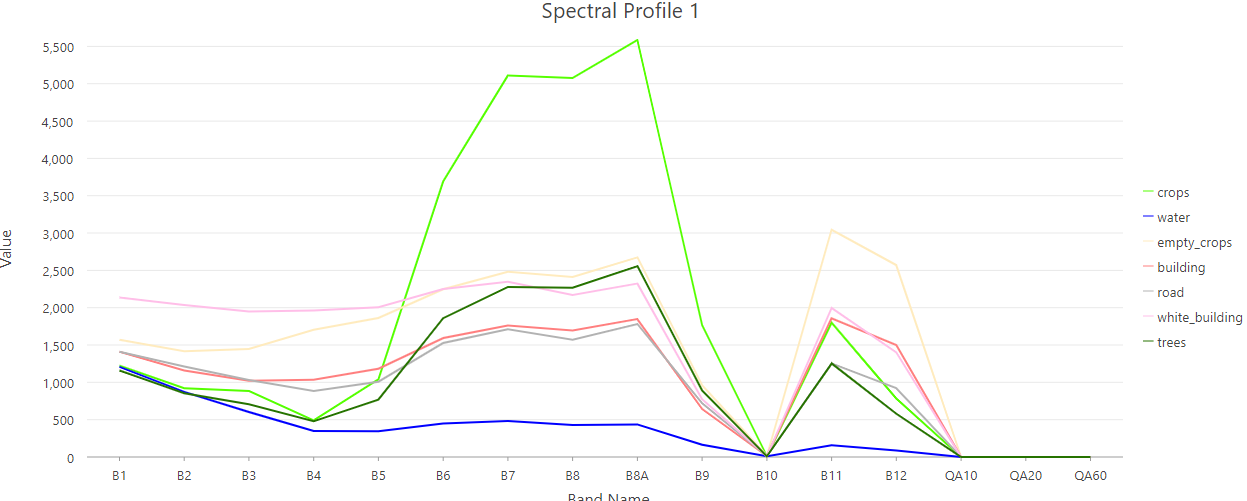
Skills Aquired: Doing the prep work I learned what color composites are and how I can manipulate them to best present information. I also learned how to adjust the band settings on ArcGIS in order to accomplish the color composite that I need. What is more, I now know a little about spectral profile and how to make/acquire one through ArcGIS. (The practice one I made can be seen below!)
ASSIGNMENT
Exploring classification schemes
The goal for this assignment was to explore different classification schemes and find the one that best classifies landcover of a chosen region of interest. For me, this region of interest is the city of Utrecht. With this in mind, I ran a satellite image of this area under 3 different types of classification:
Unsupervised Pixel Based Classification
Unsupervised Object Based Classification
Supervised Pixel Based Classification
An unsupervised classification sheme depends on the system's ability to identify patterns and structures from unlabeled data, on either a pixel by pixel basis or through object recognition.
Supervised classification functions similarly except that the system is given a base-layer to work off of. Before runninig the chosen classification scheme (pixel or obeject based) you define the classification classes you want to identify and then manually label some regions of your image to calibrate and facilitate class recognition.
(Press image to expand map.)
Unsupervised Pixel Based Classification
Unsupervised Object Based Classification
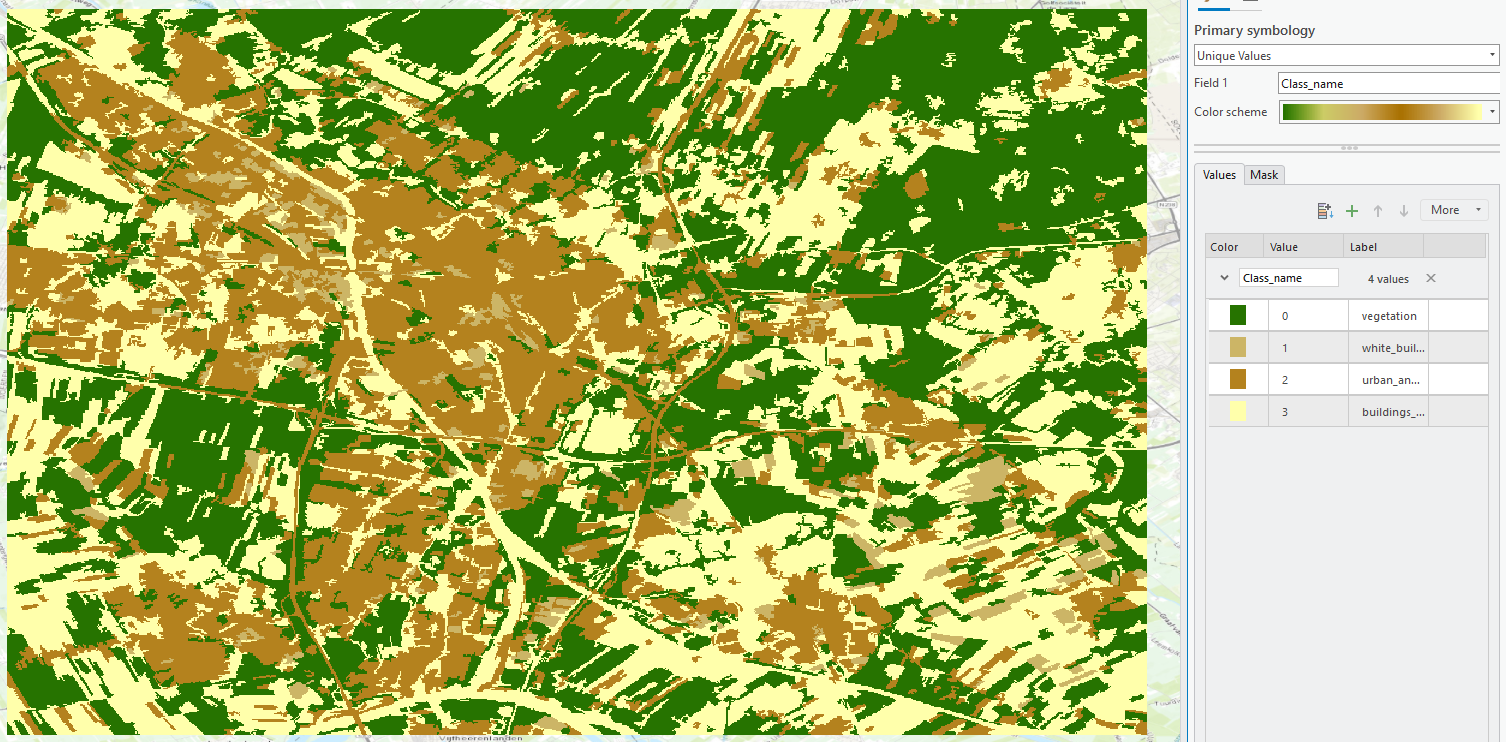
Supervised Pixel Based Classification
From this analysis, it can be concluded that the best classification scheme for this region was "supervised pixel based classification" as it was much more accurate in identifying and mapping land use. There are still a few errors when looking at buildings and crops, but this is minimal in comparison to the first two maps.
Skills Aquired: Through the assignment I learned how to analyse classification schemes on ArcGIS is and further understood the advantages and drawback of each shceme. I also learned the importance and advantage to local knowledge when it comes to landcover imaging.
NDVI: Normalized Difference Vegetation Index
The Normalized Difference Vegetation Index (NDVI) is a numerical indicator used in remote sensing to measure and analyze vegetation health and presence on Earth's surface. It is calculated using the reflectance of near-infrared and red light, with values ranging from -1 to +1. Higher positive values indicate dense, healthy vegetation, while negative values indicate non-vegetative surfaces like water or urban areas. NDVI is widely used in agriculture, forestry, environmental monitoring, and climate studies to monitor vegetation changes over time. Despite its usefulness, NDVI can be affected by atmospheric conditions and soil backgrounds.
The previously established region of interest (city of Utrecht) was analysed using NDVI to scan for vegetation and further define landuse classifications. The results can be seen below in an interactive map together with previous analyses of the area, which can be navigated using the layers tab.
Skills Aquired: This part of the assignment taught me about using indices to highlight certain landuses (such as vegetation), and learned how to apply this analysis through ArcGIS. Furthermore, I developed my skills on Esri Online through creating the interactive map.
SUMMARY
Unsupervised object based – technique used in remote sensing and image analysis to classify objects in an image without predefined training data or labels.
- Strengths: no human error, no need manually classify, quick
- Weaknesses: inaccurate, unwanted classifications
- Strengths: no human error, no need manually classify, quick
- Weaknesses: inaccurate, unwanted classifications
- Strengths: significantly more accurate, tailored to desired classification
- Weaknesses: manual data input, time consuming
- Strengths: easy to use, quick, provides a quantitative measure, accounts for change in time
- Weaknesses: sensitive to atmospheric changes, soil quality affects certain band reflection.