4. Relative Elevation Model (REM)
Key Terminology: Definitions and Relevance for Mapping and Calculating Areas for Carbon Offset Planning
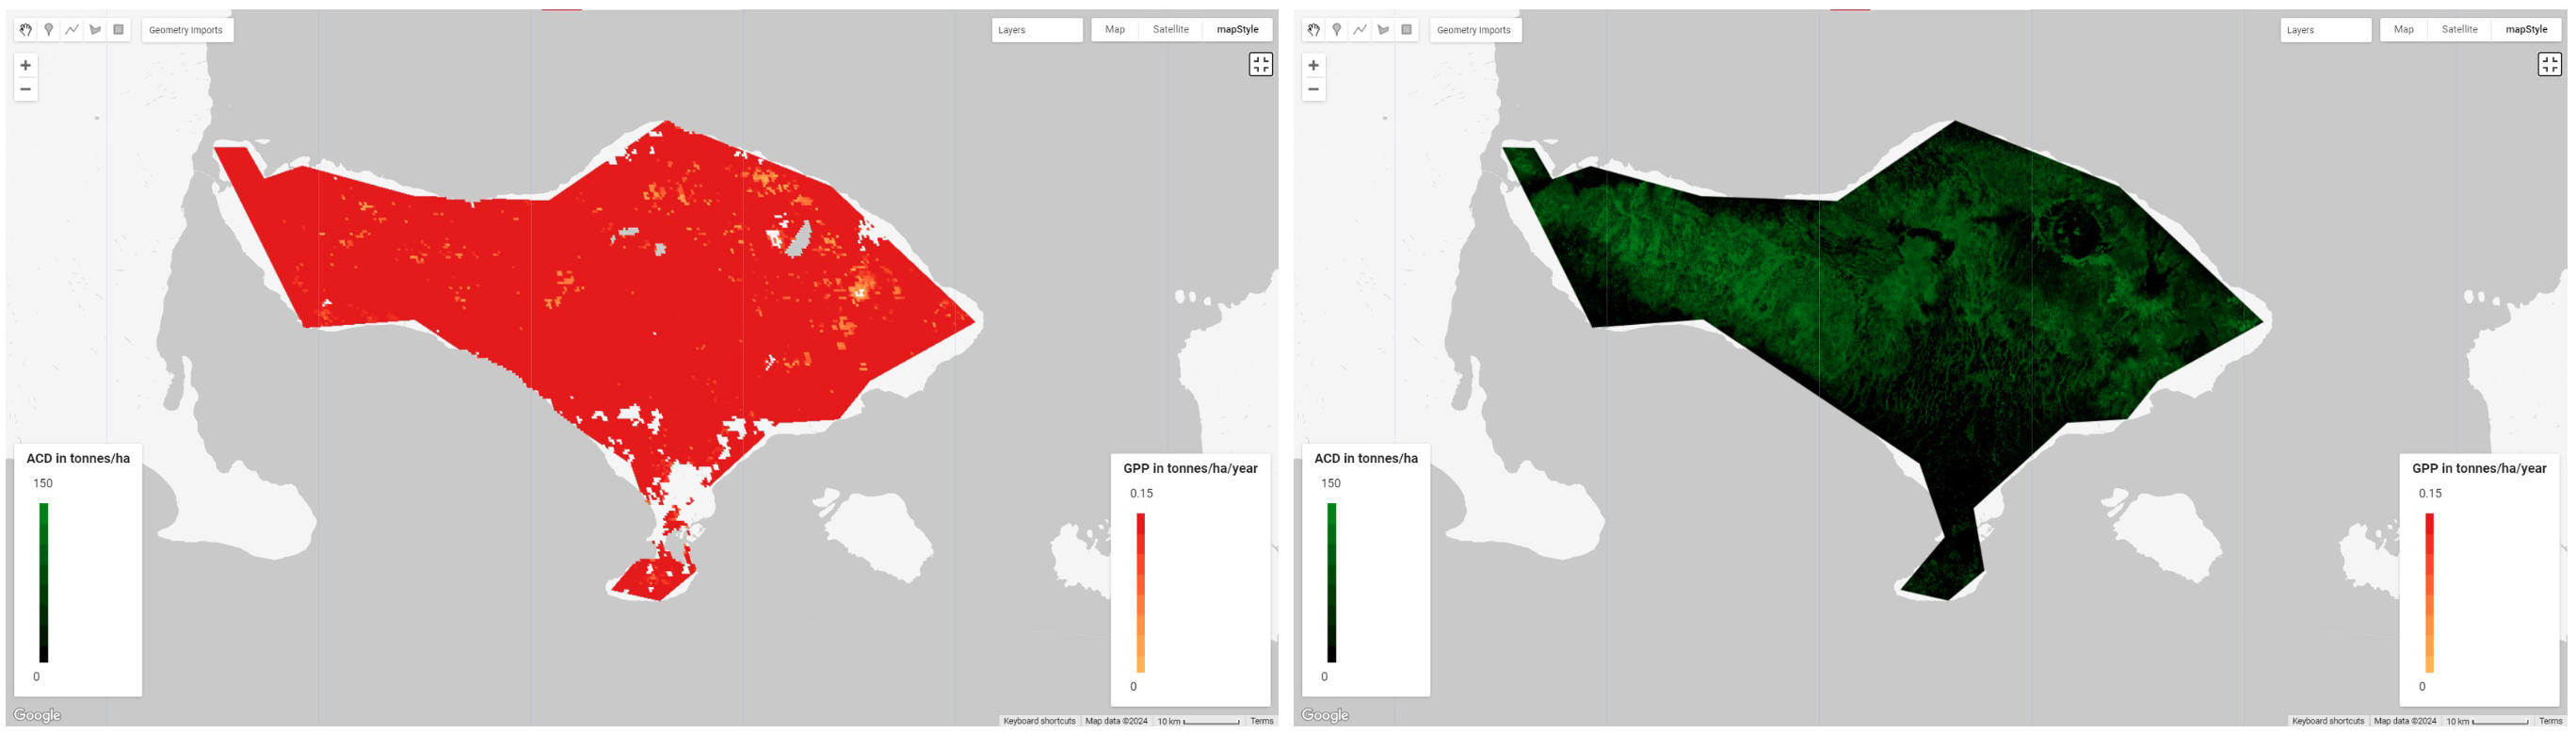
Gross primary production (GPP)
- Amount of carbon captured through photosynthesis of all producers in a defined region.
- This is useful for mapping carbon as photosynthesis is part of the carbon cycle. This step shows how much carbon is being taken from the atmosphere and being used up by producers.
Aboveground carbon density (ACD)
- Amount of carbon that is stored in living vegetation on Earth’s surface. This is an approximation measured by recording the area of a plant that is above ground (e.g. from trunk base to highest branch).
- The ratio between ACD and GPP gives us total carbon sequestration by producers.
Forest Cover (FC)
- A measure of how much land is available for carbon sequestration in a defined area based on land usage.
- Relevant for land use planning (how spaces can be used and/or changed based on carbon sequestration needs).
Carbon sequestration potential index (CSPI)
- An indicator that determines carbon sequestration potential. All three other variables are taken into account to determine this final indicator.
- Once again, useful for land use planning and management.
All four of these are relevant in mapping within a climate action context.*
Chosen region of interest (ROI): the island of Bali, southern Indonesia.
What is the geography and climate of Bali?
Bali has a tropical climate. It is quite mountainous in certain (inland) areas as well as coastal along the perimeter of the island. Bali is surrounded by coral reefs. In fact, it forms part of the Coral Triangle, the area with the highest biodiversity of marine species on the planet. Still, there are many areas on the island which are more developed and densely populated due to tourism.
Using Google Earth Engine
The main portion of this assignment was to map the previously defined 'Aboveground Carbon Density (ACD)' and the 'Gross Primary Production (GPP)' of the ROI. To achieve as much, an 'above-ground biomass' dataset for the year 2020 was obtained from European Space Agency Biomass Climate Change Initiative – open source data – and introduced into CSPI code through Google Earth Engine. The code was then taylored to the ROI and once run, the two layers in the interactive map below were procured. (Other key values can also be seen to the right [3 sgf.].)
Skills Aquired:During this assignment I learned to use a new coding program on a new mapping engine, further expanding my GIS knowledge. More so, I learned about new perspectives to analyse biomass and carbon data, as well as, continued acknowledgement of the importance of open source data.
Mean GPP 0.603 tC/ha/y
Mean CSPI 0.00187
ACD 47.4 tC/ha
FC 85.3%
Recommended conservation area placement and recommended planting:
It is recommended that the whole area is placed under conservation given the really low CSPI value for this region. As for planting, regions on the GPP map shown in light orange would be recommended as they show low carbon sequestration levels. (Regions in white along the coast are not viable for extra planting as these are beaches and built-up urban areas.)